The Developer's Browser Problem
Developers live in Chrome. On any given workday, a developer's Chrome window might contain: API documentation for two or three libraries, a Stack Overflow answer from 2019 that somehow still works, localhost on three different ports, a staging server, a production dashboard, GitHub pull requests, Jira or Linear tickets, a CI/CD pipeline view, Figma designs, and Slack in a pinned tab.
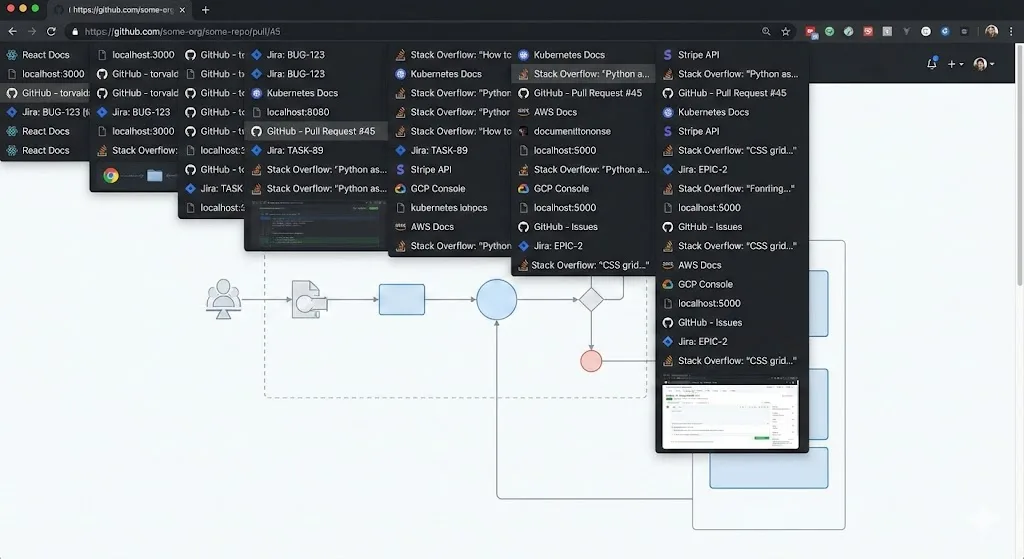
Multiply that by two or three active projects, and you have 60-80 tabs with no clear way to tell which project they belong to. The tab bar becomes a sea of identical favicons. You spend more time finding the right tab than you spend actually reading it. And when you need to context-switch between projects, you either keep everything open (killing your RAM) or close things and hope you can find them again (you cannot).
This is a solvable problem. Chrome's tab groups, combined with a snapshot workflow, give developers the ability to maintain separate project contexts and switch between them cleanly.
Tab Groups Per Project
The foundational practice is one tab group per project. Every tab you open for Project A goes into the Project A group. Every tab for Project B goes into the Project B group. Color-code them distinctively so you can tell at a glance which context you are in.
Here is a typical developer's tab group structure:
| Tab Group | Color | Typical Contents |
|---|---|---|
| Project Alpha | Blue | GitHub repo, Jira board, API docs, localhost:3000, staging URL |
| Project Beta | Green | GitHub repo, Linear board, design system docs, localhost:8080 |
| DevOps / Infra | Red | AWS console, CI/CD dashboard, monitoring (Datadog/Grafana), incident channels |
| Learning / Reference | Purple | Docs you are studying, tutorial tabs, conference talk recordings |
| Admin | Grey | Email, calendar, Slack, time tracking |
When you are working on Project Alpha, collapse all other groups. Your tab bar shows only the tabs relevant to your current task. When a Slack message pulls you into Project Beta, expand that group and collapse Alpha. The switch is instant and visual.
The Documentation Tab Problem
Documentation tabs are a category unto themselves. A typical debugging session might involve React docs, TypeScript docs, a CSS reference, the MDN Web Docs for a specific API, and three Stack Overflow threads. These tabs are valuable while you are solving the problem and worthless afterward. But you never know when "afterward" is because the same issue might come back.
The solution is to keep documentation tabs within the project group they are relevant to, and let the snapshot system handle their persistence. When you save a snapshot of your Project Alpha group, you capture all the documentation tabs that were part of that working context. If the issue resurfaces, restoring the snapshot brings back not just the code-related tabs but the exact documentation you had open.
This is significantly more useful than bookmarking documentation pages, because the value is not the documentation URL itself (you could find that again). The value is the specific combination of tabs that represents a working context for a specific problem.
Localhost, Staging, and Production
Developers constantly switch between environments. You might have localhost:3000 for the frontend, localhost:8000 for the API, a staging URL for integration testing, and the production URL for verifying deployments. These tabs look almost identical in the tab bar -- they often share the same favicon and differ only in the URL.
Grouping environment tabs within a project group and using a consistent ordering convention helps. For example, always put environments in this order within a group: localhost, staging, production. The consistent position means you can rely on muscle memory rather than reading every tab title.
Some developers go further and create separate sub-groups or color conventions for environments within a project. A red tab group for production, yellow for staging, blue for development. This adds overhead but can prevent the expensive mistake of modifying something in production when you thought you were in staging.
Environment Safety Tip
Consider using a separate Chrome profile for production admin panels. Profile switching is more heavyweight than tab groups, but it provides a hard boundary between environments where mistakes can be costly.
Context Switching Between Projects
Context switching is the developer's biggest productivity drain. Studies consistently show it takes 15-25 minutes to fully re-engage with a complex task after an interruption. A significant portion of that time is spent rebuilding the working context: what tabs were open, what state was the app in, where were you in the debugging process.
Tab group snapshots dramatically reduce this recovery time. Before switching away from a project, save a snapshot. The snapshot captures your entire working context: every tab, its position, and the group structure. When you return, restore the snapshot and you are back exactly where you were.
TabGroup Vault
Save and restore Chrome tab groups with one click. Built for multi-project workflows. Free tier: 5 snapshots. Pro ($29 one-time): unlimited snapshots, bulk restore, Google Drive backup, 5 Chrome profiles, dark theme. No subscription.
For developers who work on 2-3 projects concurrently, this typically means maintaining 2-3 snapshots that get updated throughout the day. The pattern is: save, switch, work, save, switch back, restore. Each transition takes seconds instead of the 10-15 minutes of manually reopening and re-finding tabs.
Chrome DevTools and Tab Organization
Chrome DevTools is the developer's primary debugging tool, and its effectiveness improves when your tabs are organized. When you open DevTools on a specific tab, it attaches to that tab's context. If you have 70 unsorted tabs, finding the right one to attach DevTools to is a chore. When your tabs are grouped by project, you know exactly which group contains the localhost or staging tab you need to inspect.
A few DevTools habits that pair well with tab groups:
- Pin your primary DevTools tab. If you are debugging a specific page, pin it at the start of its group so you always know where it is.
- Use DevTools' own tab management. Keep Network, Console, and Elements panels docked. Undock only when you need a second-screen view.
- Close DevTools when switching projects. An open DevTools panel on a tab you are not using consumes memory. Close it when you collapse a project group.
Team Workflows and Onboarding
Tab group snapshots have an underappreciated use in team contexts: onboarding. When a new developer joins a project, they need to find and open a dozen tabs: the repo, the documentation, the project board, the CI pipeline, the design system, the staging URL, and more. Instead of writing a list of URLs in a README, export a tab group snapshot and share it. The new developer imports it and has the entire project context open in seconds.
This is also useful for incident response. When a production issue arises and the on-call engineer needs to investigate, a pre-built snapshot for the service in question (containing the monitoring dashboard, logs, deployment pipeline, and runbook) gets them oriented immediately rather than scrambling to open the right tools.
Chrome Profiles vs. Tab Groups
Chrome profiles and tab groups solve related but different problems. Here is when to use each:
| Use Case | Chrome Profiles | Tab Groups |
|---|---|---|
| Separating work and personal browsing | Best choice | Works but weaker boundary |
| Switching between projects during the day | Too heavyweight | Best choice |
| Different auth credentials per environment | Best choice | Cannot handle separate auth |
| Quick visual context switching | Requires window switching | Instant within one window |
| Sharing workspace with a teammate | Cannot share profiles | Can export/import snapshots |
The ideal developer setup often uses both. A Chrome profile for work (separate from personal), and tab groups within that profile for different projects. TabGroup Vault Pro supports up to 5 Chrome profiles, so your snapshots stay organized per profile.
Recommended Developer Extension Stack
Beyond tab management, here are extensions that complement a developer workflow:
- TabGroup Vault -- Save and restore project tab groups. The core of your context-switching workflow.
- JSON Viewer -- Format raw JSON responses in the browser. Essential when working with APIs.
- React Developer Tools (or Vue/Angular equivalent) -- Component inspection and state debugging.
- Wappalyzer -- Identify the tech stack of any website. Useful for competitive analysis and client projects.
- Refined GitHub -- Quality-of-life improvements for GitHub's interface.
For more extension recommendations, see our list of the best Chrome extensions for 2026.
A Practical Starting Point
If you are currently a tab-chaos developer (no judgment -- most of us have been there), here is a 10-minute setup to get started:
- Group your current tabs by project. Right-click, "Add to group," and sort everything that is currently open. This alone will bring immediate clarity.
- Name and color each group. Use project names or codenames. Pick colors that are distinct enough to tell apart at a glance.
- Install TabGroup Vault and save your first snapshot. This creates a safety net for your current workspace.
- Collapse groups you are not working on right now. Focus on one project at a time.
- Commit to saving a snapshot before every project switch. Make it a habit. It takes two seconds.
That is it. No complex system, no productivity philosophy. Just group, save, and switch. The complexity can grow as needed, but most developers find that this basic workflow eliminates 80% of the tab management friction they experience daily.